
Demonstration notes
How to read the demonstrations.
Infraqen is a working prototype. These notes give the counting definitions, sources, dates and limits behind the figures on the home page, one level deeper. The two demonstrations answer different questions, their results are not comparable, and neither is a validation study.
California, USA · Fresno County and Los Angeles County
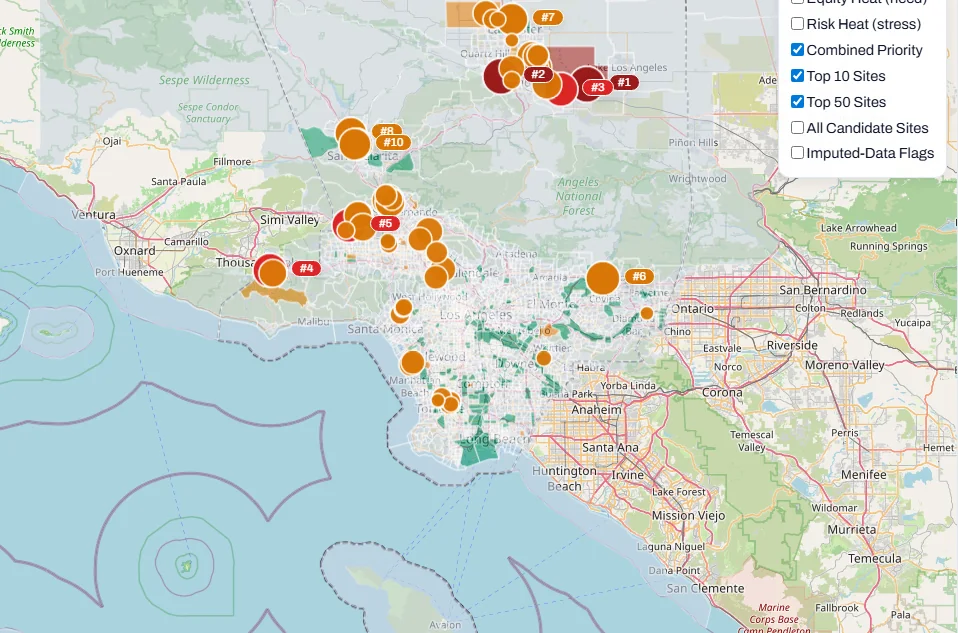
California: screening large buildings for solar-plus-storage resilience review
The question is a triage question: which of a county’s large buildings should be studied first as candidates for solar-plus-storage resilience projects, and on what evidence. The demonstration does not approve or design any project; the system sizes it models are screening assumptions.
What was screened
Two runs, frozen on 23 June 2026, one per county. Only the largest buildings were scored, chosen by footprint size before any other criterion was considered.
| County | Eligible buildings (footprint ≥ 500 m²) | Largest buildings scored | Shown in the ranked list |
|---|---|---|---|
| Fresno County | 22,160 | 50 | 20 |
| Los Angeles County | 133,900 | 700 | 670 |
How a building is ranked
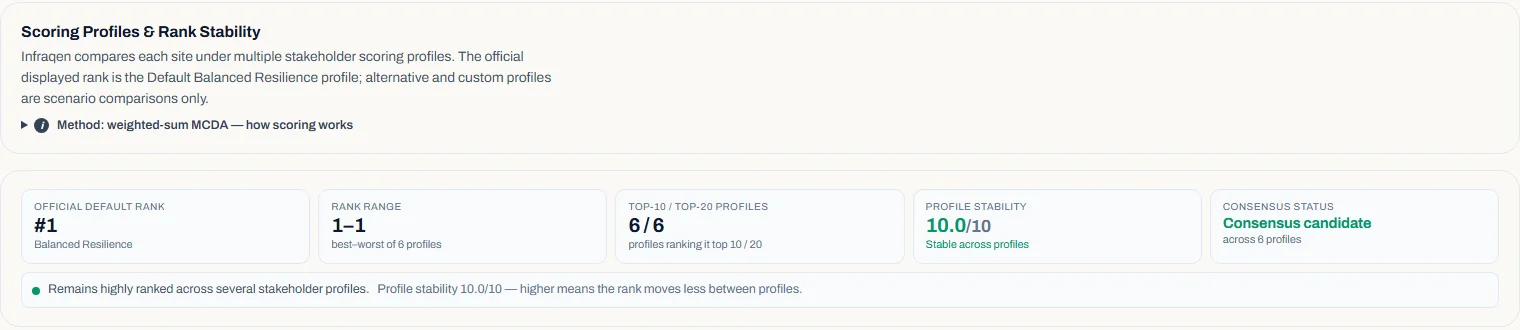
Each scored building receives six criterion scores, combined with stated default weights into a Technical Suitability Rank. Other weightings can be compared as scenarios without replacing it. The rank orders buildings within one run only; scores are not comparable across runs or counties.
| Criterion | What it measures | Default weight |
|---|---|---|
| Community burden | CalEnviroScreen 4.0 score of the building’s census tract; a median value is filled in and flagged where none links | 25 % |
| Critical-facility proximity | Whether the building is, or lies near, a critical facility such as a hospital, school, fire or police station (public facility points and OpenStreetMap tags). Proximity is not an electrical service relationship | 20 % |
| Solar yield (modelled) | Modelled photovoltaic output for the building (NREL PVWatts), with system size capped at 1,000 kW — a cap reached by every scored building | 15 % |
| Wildfire risk | FEMA National Risk Index wildfire risk score of the census tract, from a published edition of the index — a current-conditions indicator, not a projection and not grid stress | 15 % |
| Critical-load backup (modelled) | Modelled hours a solar-plus-battery system could carry critical load during a 72-hour outage | 15 % |
| Indicative economics | A payback-based score from stated cost and electricity-price assumptions (one assumed average price) — not a quote or an investment case | 10 % |
A separate 0–10 Impact Score indicates where action may matter most. It never changes the rank. It is left blank when one of its components cannot be computed — in the demonstration, wherever the community-burden value was missing, including all ten top-ranked Los Angeles buildings.
How sensitive the shortlist is
Results are scenario-dependent. Five alternative weight profiles can be compared with the default; with equal weights, 18 of the top 20 stay in the top 20 in both counties, and the other profiles each change between 1 and 6 of the top 20. The shortlist also moves when engineering assumptions such as the solar system size cap change, and when missing data are treated differently. Each ranking is checked by re-weighting it many times and by a second ranking method, and buildings whose position depends on those choices are marked. Rank stability is not a probability that a project succeeds.
Known limits
- Only the largest buildings were scored; most eligible buildings were never assessed.
- No utility network, hosting-capacity, interconnection, tariff or metered-consumption data was used, and the serving utility was not identified for any building.
- Community-burden values are filled in where none links to the building’s tract — including for all ten of the highest-ranked Los Angeles buildings, which therefore need a data check before any review is commissioned.
- Solar yield, backup hours and economics are modelled screening estimates, not measurements or quotes.
- Hazard information is a current-conditions indicator taken from a published edition of the FEMA National Risk Index; it is not a climate projection.
- The California results have not been independently validated.

The Netherlands · The Hague (Den Haag)
The Hague: building-level evidence for an assessed cohort
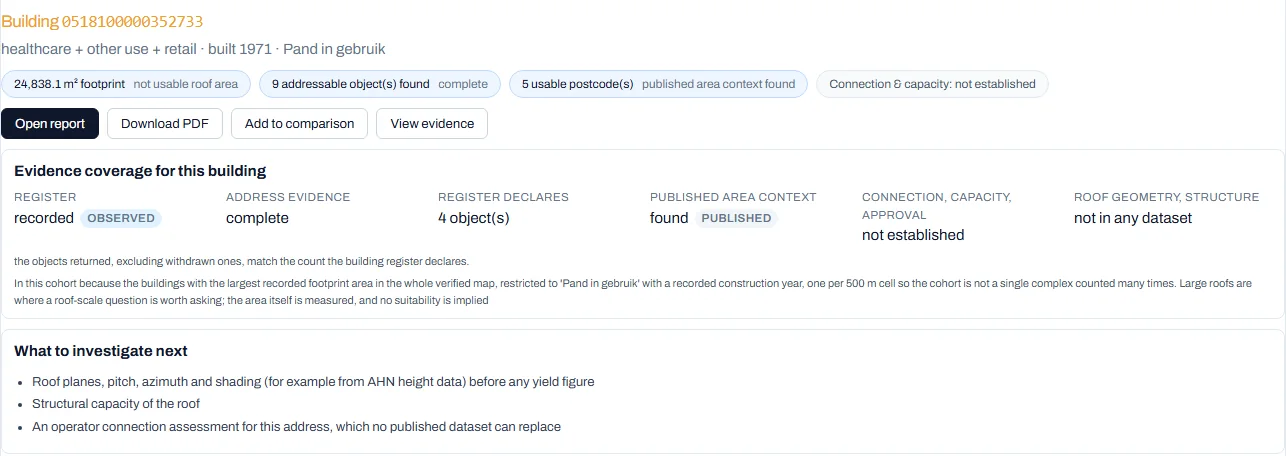
For a defined set of buildings, the demonstration records what public Dutch registers and statistics establish, how complete that evidence is, and what would have to be checked next. It is descriptive: no suitability score or ranking, no engineering yield model, no economics or investment recommendation, and no connection or capacity assessment for any building. Each building report includes one clearly labelled, simplified illustrative generation figure — arithmetic on the recorded footprint, observed regional irradiation and three stated assumptions — which is not a measured or engineered yield. Assessment built on 25 September 2026 (method revision 3, which changed no figure from revision 2).
What the figures count
- 73Buildings assessed
- All buildings the municipal building map places in one 500 m grid cell on the city’s south-western edge (49), plus the 24 largest recorded building footprints in the municipality, taking at most one per 500 m cell (all in use, with a recorded construction year, at least 2,000 m²). 73 of the 167,605 buildings in the municipal building map; two stated selections, not a sample of the city.
- 1,545Addressable-object records
- BAG addressable objects (verblijfsobjecten) returned for these buildings by bounded queries to the public BAG service on 20 September 2026, each counted once and in every lifecycle state: 1,372 not withdrawn plus 173 the register marks as withdrawn. The register’s own building records listed 1,583 that day, so this is a lower bound. Records were found for 32 of the 73 buildings; three large buildings hold 1,213 of them. They are register records — not households, customers, meters or grid connections.
- 68Distinct postcodes
- Distinct six-character postcodes on those records, from 30 of the 73 buildings (64 if withdrawn records are left out). A postcode is used only to look up published area-level context.
- 40 · 38Coverage gaps: 40 buildings · 38 records
- For 40 of the 73 buildings the building register lists no addressable object, and the retrieval agrees. Address counts come from bounded queries and can be lower than the register: 38 of the 1,583 records the register listed on 20 September 2026 were not returned, across 3 buildings.
What the workflow shows
- A reference map of the municipality with 167,605 building footprints from the national register over the public Dutch background map, with the assessed buildings outlined. The map shows no capacity, congestion or suitability colours.
- An evidence view per building: what the register records, which address records were found and how complete that retrieval is, published averages for its postcode area, regional weather from the nearest national weather station, and what to investigate next.
- The working prototype generates a report for each of the 73 buildings plus one cohort-level area report: 74 documents, each rendered as HTML and PDF.
- Side-by-side comparison of any two or three assessed buildings, with its own HTML and PDF report that states it is a comparison of available evidence, not a ranking, a score or a recommendation.
Postcode-area context
For 29 buildings, the grid operator Stedin’s published small-consumer averages for the matching postcode groups are attached as area context: averages per connection over groups of at least 10 connections, never the building’s own consumption, and never summed across buildings into a total. Where a building’s postcodes fall in several published groups, the figure shown is the connection-weighted average of those groups.
Known limits
- The 73 buildings are a selected cohort for demonstration — not customers, installations, grid connections or a sample of the city.
- Grid-operator supply-area maps are not included: permission to retrieve and use them for this purpose has not been established.
- Retrieval dates are not the publishers’ observation dates. Apart from the background map tiles, nothing is fetched live.
- The work has not been independently reviewed by a domain specialist.


Sources and licences
The Hague
| Source | Publisher | Retrieved | Licence |
|---|---|---|---|
| Building register (BAG) — buildings | Kadaster via PDOK | 10 Sep 2026 | CC0 1.0 |
| Building register (BAG) — addressable objects | Kadaster via PDOK | 20 Sep 2026 | CC0 1.0 |
| Municipal boundary (Bestuurlijke Gebieden) | Kadaster via PDOK | 10 Sep 2026 | CC BY 4.0 |
| Background map (BRT-Achtergrondkaart) | Kadaster via PDOK | shown live in the prototype | CC BY 4.0 |
| Key figures for districts and neighbourhoods (2025; energy figures from 2024) | CBS | 10 Sep 2026 | CC BY 4.0 |
| Hourly weather observations (to 2025) | KNMI | 12 Sep 2026 | CC BY 4.0 |
| Small-consumer data by postcode area (2026) | Stedin open data | 3 Sep 2026 | CC BY 4.0 |
In the prototype, the background map is © Kadaster / PDOK, BRT-Achtergrondkaart (CC BY 4.0), the municipal boundary is from PDOK / Kadaster, Bestuurlijke Gebieden (CC BY 4.0), and building footprints are from PDOK / Kadaster, BAG (CC0 1.0). The screens of The Hague on this site show no background map; the building outline in the report image is from the BAG.
California
US Census TIGER/Line boundaries (2025), Microsoft US building footprints, CalEnviroScreen 4.0 (California OEHHA), the FEMA National Risk Index, NREL PVWatts modelled solar output, public critical-facility locations and OpenStreetMap building types. The vintages of CalEnviroScreen and the National Risk Index are taken from the run configuration. Map images: © OpenStreetMap contributors.
Software checks
26 September 2026. On the release candidate prepared for The Hague demonstration, the automated test suite of the Python analysis and data-processing code ran with 2,413 tests passed, 10 skipped and none failed, and all 898 automated tests of the web application passed. These tests check how the software behaves and handles data. They do not measure the accuracy of any result, and they are not an external review.
For the 73 buildings in The Hague cohort, the assessment’s figures were cross-checked in September 2026 by separately written recomputation scripts that do not use the platform’s code. Where possible they re-derived the figures from the same pinned source files; otherwise they checked that the reports, comparisons and web application reproduce the assessment’s values. The scripts were written in-house with AI assistance, so this is an internal consistency check — not independent, third-party or specialist validation — and agreement does not show that the source data or the method are correct.
AI assistance is used in developing and reviewing the software. The product shown in the demonstrations does not include AI forecasting or optimisation features.