Working prototype · California and The Hague demonstrations

Evidence for better energy infrastructure decisions.

Infraqen brings building, energy, infrastructure and risk data into traceable maps, reports and comparisons, helping planners identify where deeper technical review is needed — and what evidence is still missing.

What Infraqen does

From scattered records to a reviewable planning picture.

Early decisions about where to spend planning effort depend on records that rarely sit together: building registers, energy statistics, hazard layers and infrastructure context. Infraqen connects them to one planning question and keeps each step open to review.

  1. 01

    Frame the question

    Define the planning question and the buildings or candidate sites in scope.

  2. 02

    Connect the records

    Join public building, energy, infrastructure and risk data to each building or site, from named sources fixed at a recorded date.

  3. 03

    Inspect and compare

    Review maps, building or site reports and side-by-side comparisons, with missing and filled-in values flagged as such.

  4. 04

    Identify the next review

    See which buildings or sites deserve engineering, utility or specialist review — and which evidence has to be collected first.

A working prototype for early planning. It does not replace engineering studies, utility interconnection analysis, official eligibility review or investment approval.

Demonstrations

Two demonstrations. Two different planning questions.

California tests screening and prioritisation of large buildings across a county. The Hague tests building-level evidence assessment in a European city. They use different data and produce different kinds of result, so their results are not comparable — and neither is a validation study.

California, USA · Fresno County and Los Angeles County

Screening and prioritisation

Which large buildings should be studied first for solar-plus-storage resilience?

Planning question
Which of a county’s large buildings should be studied first as candidates for solar-plus-storage resilience projects — and on what evidence? A triage question, not an approval.
Workflow shown
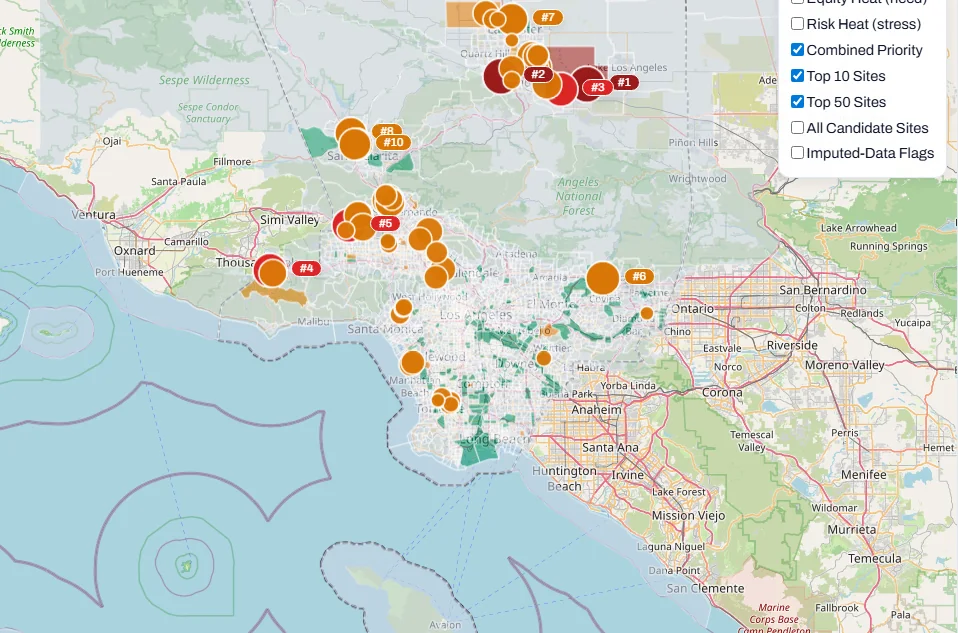
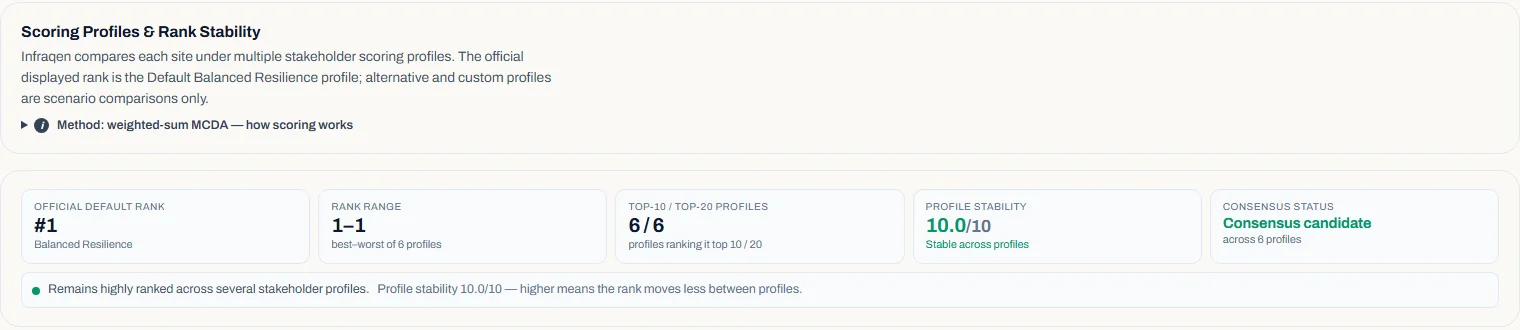
A county map with a ranked shortlist; a detail view for each ranked building with its criterion scores, a plain-language rationale and flags for missing or filled-in inputs; alternative weightings compared as scenarios; and an evidence pack for each run (browser report and PDF).
Evidence
Six criteria from public data — modelled solar yield, community burden (CalEnviroScreen 4.0), wildfire risk (FEMA National Risk Index), whether the building is or is near a critical facility, modelled critical-load backup during a 72-hour outage, and indicative economics — in two runs frozen in June 2026.
Result
A Technical Suitability Rank from stated default weights, within each analysed set of buildings: a starting point for engineering review, not a feasibility finding.
Limits
Only the largest buildings were scored. No utility network, hosting-capacity or interconnection data was used. The order changes with weights and assumptions. Community-burden values are filled in for Fresno’s top two and all ten top-ranked Los Angeles buildings, so those positions need a data check. Not independently validated.

Buildings screened per county

  • 50 of 22,160Fresno County buildings scored · 20 shown in the ranked list
  • 700 of 133,900Los Angeles County buildings scored · 670 shown in the ranked list

Eligible = a building footprint of at least 500 m². The largest were scored, chosen by size before any other criterion. Frozen runs of 23 June 2026.
Demonstration notes for California

The Netherlands · The Hague (Den Haag)

Building-level evidence assessment

What do public records establish about each building — and what is missing?

Planning question
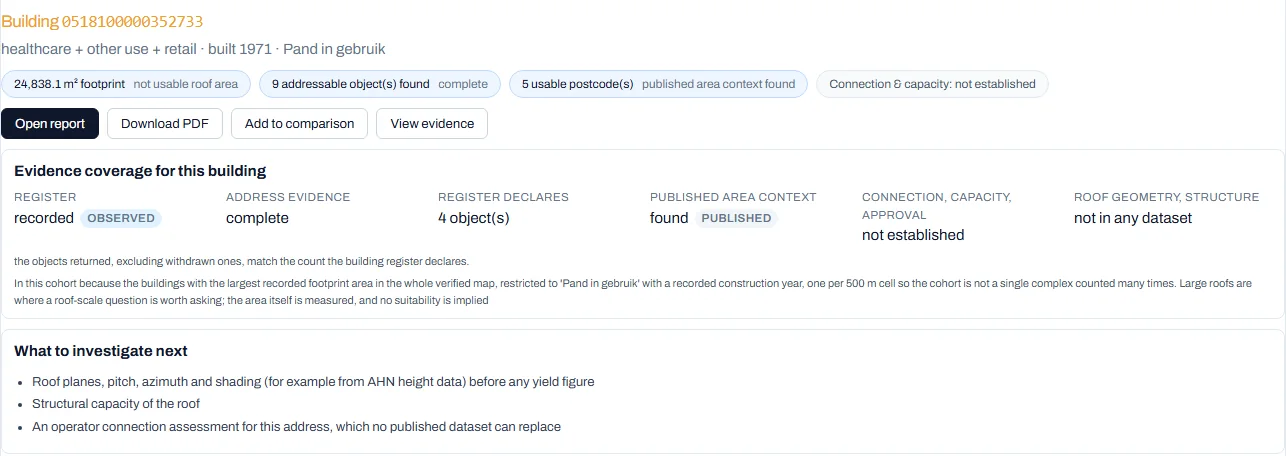
For a defined set of buildings, what do public Dutch registers and statistics establish, how complete is that evidence, and what would have to be checked next?
Workflow shown
A reference map of the city with the assessed buildings outlined, a searchable building list, an evidence view for each building, side-by-side comparison of any two or three buildings, and building, area and comparison reports in HTML and PDF.
Evidence
Public Dutch sources retrieved in September 2026 — the national building and address register (BAG), municipal boundaries (PDOK / Kadaster), CBS statistics, KNMI weather observations and Stedin’s small-consumer open data — shown over the live PDOK background map.
Result
A descriptive evidence assessment: no suitability score or ranking, no engineering yield model, no economics or investment recommendation, and no connection or capacity assessment for any building. Each building report shows one clearly labelled illustrative generation figure — arithmetic on stated assumptions, not a measured or engineered yield.
Limits
A selected cohort, not a citywide sample. Grid-operator supply-area maps are not included: permission to use them for this purpose has not been established. The work has not been independently reviewed by a domain specialist.

Assessed cohort, assessment built on 25 September 2026

  • 73buildings assessed
  • 1,545addressable-object records
  • 68distinct postcodes

73 buildings: all buildings the municipal building map places in one 500 m grid cell on the city’s south-western edge (49), plus the city’s 24 largest in-use building footprints, taking at most one per grid cell. Address records are BAG addressable objects returned by bounded queries on 20 September 2026, in every lifecycle state — 173 are marked withdrawn — and a lower bound: the register listed 1,583 that day. Records were found for 32 of the 73 buildings. Postcodes are distinct six-character postcodes on those records (64 without withdrawn records). Not customers, installations, grid connections or a sample of the city.

Demonstration notes for The Hague

How evidence is handled

Results you can trace back to their evidence.

A planning result is only as useful as the evidence behind it. In the demonstrated workflows, the sources, assumptions, missing data and limitations behind a result can be inspected, so a reviewer can see what is established — and what is not.

  1. Named public sources

    Each demonstration names the public datasets it rests on. In The Hague, a sources-and-method view lists where each figure comes from and what it cannot say; in California, each ranked building carries its criterion scores and a plain-language rationale.

  2. Stated geography

    Each figure keeps its level — building, postcode area, census tract or county. A postcode-area average is never presented as a building’s own consumption.

  3. Fixed dates

    Each demonstration rests on data retrieved or run on a recorded date — June 2026 for California, September 2026 for The Hague. Nothing in them is live utility data.

  4. Labelled assumptions

    Modelled values — solar yield, indicative costs, weightings — are labelled as assumptions, not presented as measurements.

  5. Visible gaps

    Missing, withdrawn and filled-in values are flagged rather than hidden; in The Hague every count carries its denominator. A retrieval that returned nothing is not read as proof that nothing exists.

  6. Scenarios where a ranking exists

    In California, alternative weightings are compared as scenarios beside the default rank, showing how sensitive the shortlist is to priorities. The Hague work has no ranking to test.

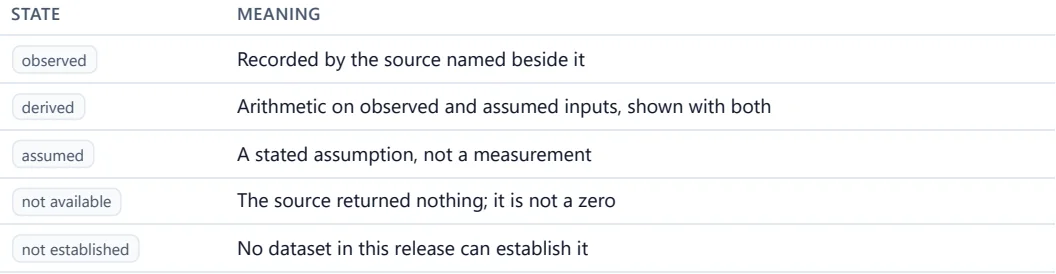
Table with two columns, State and Meaning: observed — recorded by the source named beside it; derived — arithmetic on observed and assumed inputs, shown with both; assumed — a stated assumption, not a measurement; not available — the source returned nothing, it is not a zero; not established — no dataset in this release can establish it.
The Hague · Comparison report, closing pageThe legend printed at the end of a comparison report: a value recorded by a named source, arithmetic on stated inputs, an assumption, a source that returned nothing (not a zero), and something no dataset used can establish are each labelled differently.

Decision boundary

Infraqen helps decide where deeper review is needed. Expert review decides what gets built.

Infraqen supportsScreening and prioritisationBuilding-level evidence reviewSide-by-side comparison
Expert review decidesEngineering feasibilityGrid connection and capacityInvestment approval

Maturity

What is demonstrated — and what is not.

Infraqen is a working prototype, available for private, locally run demonstrations. The lists below keep today’s capabilities apart from what is unavailable and what is only planned.

Demonstrated in the prototype

  • Screening and ranking of candidate buildingsCalifornia — Fresno and Los Angeles counties, runs frozen in June 2026
  • Alternative weight profiles to test the shortlistCalifornia only
  • Building evidence assessment, reports and comparisons of two or three buildingsThe Hague — 73 assessed buildings, September 2026
  • Missing and filled-in values flagged rather than hiddenBoth demonstrations; The Hague also shows every count with its denominator

Not available

  • Utility network dataNo feeder, hosting-capacity, interconnection or building-level metered data is used
  • Grid-operator supply-area maps for The HaguePermission to use them for this purpose has not been established
  • A score, ranking, engineering yield or economics model for The HagueThe Dutch work is descriptive evidence; reports carry one labelled illustrative generation figure, not an engineered yield
  • Optimisation, AI forecasting or real-time controlNot part of the prototype
  • A hosted online serviceThe prototype runs locally, for private demonstrations only
  • Independent validationNeither demonstration has been independently or specialist-validated

Planned — not yet built

  • Solar technology comparisonsOn the roadmap; nothing is implemented or computed yet
  • Broader energy-system workflowsFor example detailed storage or hybrid-system design; not yet started

Who it helps

Early-planning tasks, not final answers.

Each team arrives with a different question. These are the tasks the demonstrations already cover — with the demonstration where each appears and the limit that applies.

01

Municipalities

What do public records already show about the buildings in question — and what is missing before studies are commissioned?

Tasks Infraqen supports

  1. 01Assemble building-level public evidence before commissioning studies
  2. 02Compare two or three buildings side by side, including where evidence is missing
  3. 03Share a report that carries its sources and limits
Demonstrated in

The Hague

Descriptive evidence only — no suitability score, ranking or engineering yield for Dutch buildings.

Team and collaboration

About Infraqen.

Infraqen is an early-stage venture in formation, building decision support for energy infrastructure planning.

The team

Behind Infraqen is a small team with backgrounds in software and engineering.

Collaboration

We welcome research collaboration on evidence methods, data quality and evaluation, and conversations with municipalities, utilities and developers about pilots that would test the workflow on a real planning question.

Start a conversation

Private demonstrations and pilots

Bring your planning question.

We walk through the California and The Hague workflows in a private session, and are open to discussing pilots with municipalities, utilities, researchers and developers. Contact is by email; this site has no contact form.

Request a private demo

contact@infraqen.com
Email a demo request

Prefer your own mail tool? Copy the address above.

Discuss a pilot instead

Research & technical collaboration

research@infraqen.com